 The data points properties are pre-filled as follows:• If these properties have been customized previously, these values are used, see Customizing data point properties.• If the data points have a matching definition in the Data Point Library, the values from the Data Point Library are used.There can be more than one matching data point entry in the Data Point Library. In this case, the first one is selected automatically by the system.
You can overwrite this selection by clicking the menu icon of the respective data point and selecting Load [NAME] from Library.
 • For details on modifying the visualisation in general, seeChanging data point visualization.
• For details on customizing the properties of a particular data point, see Customizing data point properties.
Info: Data points are visible to all authenticated users, regardless of their inventory role permission.
#
Changing data explorer visualization #
To change the visualization in the data explorer, you can modify several properties.
Time range
You can change the time range being shown. By default, you see the values for the last hour.
To change the time range on the X-axis,
• select a different time range from the dropdown list in the top menu bar,
• enter a custom time range into the From and To fields in the data explorer,
• drag the X-axis and move of left or right to move the time period,
• double-click into the data explorer to zoom out.
Info: Real-time updates will be switched off if you set a time range in the past.
#
Aggregation (see also Data point graph in groups) #
You may aggregate the data being displayed to get an efficient overview over larger time periods.
By default, aggregation is set to “None”. This value may be changed in the Aggregation field in the top menu bar.
Available values are “Minutely”, “Hourly” or “Daily”, depending on the selected time range.
Realtime updating
By default, realtime updating is enabled which means that the data being shown is updated as new data flows into the system from the connected devices. To turn realtime updating on or off, click Realtime in the top menu bar. A green light indicates, that realtime updating is enabled.
Data point visibility
For each datapoint, its visibility can be switched on or off by using the slider left from the data point name.
Adding data points #
To add a data point to the data explorer, click Add data point at the bottom of the Data points card.
 In the top of the dialog, select a device from the asset hierarchy. Only the asset hierarchy below the objects selected in the navigator is visible. If Data explorer in the navigator was selected, the complete asset hierarchy is visible.
The bottom of the dialog shows all data points of the selected object.
Select the data points you want to show in the data explorer.
Click Add to add all selected data points to the list of data points.
To save the data point to the Data Point Library, click the menu icon of the data point
and from the context menu select Save to library.
 For details on the Data Point Library refer to Using the Datapoint Library.
To remove a data point from the data point list, click the menu icon
and select Remove from list.
#
Customizing data point properties #
You can customize the visualization of a particular data point to your preferences. To do so, expand the data point entry in the data point list.
The following fields my be modified:
| Field | Description |
|---|---|
| Label | Name of the data point, displayed on the y-axis to identify the data point. Below the label, the target is displayed, showing the name of the asset and the internal name of the data point (measurement fragment and series). This information is not editable. |
| Unit | Unit used on the y-axis. |
| Min/Max | Range shown on the y-axis. |
| Target | The target value is currently not shown in the diagram. The value is used in the “Data Point List” widget. |
| Yellow range min/max | Defines the range when MINOR alarms should be raised by threshold rule. |
| Red range min/max | Defines the range when CRITICAL alarms should be raised by threshold rule. |
| Display | Value displayed when data is aggregated. May be “Minimum“, Maximum“, “Minimum and maximum“. |
| Chart type | The type of chart used for the visualization. May be one of “Line“, “Points“, “Line and points“, “Bars“, “Step before” (alternating between vertical and horizontal segments, as in a step function) or “Step after” (alternating between horizontal and vertical segments). Default value is “line”. |
| Y axis | Defines where the y-axis is shown. May be one of “Auto“, “Left“, “Right“. Default value is “Auto“. |
After customizing the properties of a data point, you can save the modified settings to the Data Point Library. Click the menu icon and from the context menu select Update [NAME] to library.
To return to the properties stored in the Data Point Library to a data point, select Load [NAME] from library.
Y-axis behaviour #
Per default, the first data point is positioned to the left y-axis and the remaining data points to the right. This behaviour can be changed by modifying the respective value “Y-axis” for a particular data point (to “Left” or “Right”, see above).
Each data point is shown on its own y-axis, unless the following condition is met:
Two data points having the same minimum and the same maximum value.
In this case, both data points share the same y-axis. This y-axis only shows the unit (or multiple units, in case they are different). The label is not shown.
Adding alarms or events #
In addition to data points you can also add alarms or events to the data explorer.

In the Alarms/ Events card, click Add alarm/ event to add an alarm or event.
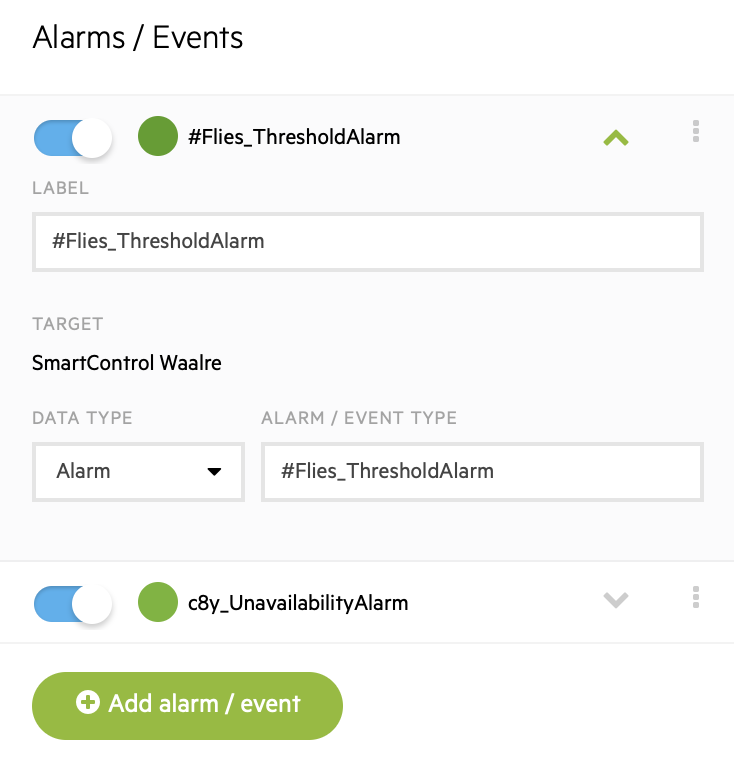
n the upcoming dialog, you can select an alarm or event from the list of recent alarms and events.
Click Add, to add your selection. Expand an event, to modify its properties.
Click the menu icon and in the context menu select Remove, to remove the entry from the list.
As with data points, you can turn the visibility of an alarm/ event in the data explorer on and off by moving the slider.
#
Creating widgets from the data explorer #
If you want to keep your current configuration in the data explorer for later usage, save it as a widget. Send as widget to dashboard
To create a widget from the data explorer of a particular asset, click More… in the top menu bar and select Send as widget to dashboard from the context menu.
[su_spa
Data explorer add events

Info: To use this function, first a dashboard has to be created. For details on dashboards, refer to Working with Dashboards.
and select Send as a widget to report from the context menu.
#
Exporting measurement data #
You may download measurement data as CSV or Excel files. The exported data shows the following information, divided into columns:
• Time when the specific measurement was taken
• Source of the measurement
• Name of the device being used
• Fragment series (e.g. c8y_SpeedMeasurement)
• Value of the measurement
• Unit used for a particular measurement (e.g. “sec” or “h”)
To export measurement data, click the More… button in the top menu bar and select either Download as CSV or Download as Excel, according to your preferences.
The download will be generated, as shown in the upcoming dialog. This make take a while, depending on the number of data points added to the data explorer. Once the loading has been completed, click Download.


